Cultura aziendale
e tecniche di gestione
Impresa globale
Strategie e analisi di opportunità
10 Maggio 2011 • di Giorgio Gandellini
Country Selection: an Integrated Decision Support Model
![]() effettua il login per scaricare il pdf
effettua il login per scaricare il pdf


Questo articolo affronta il tema della scelta preliminare di potenziali paesi di sbocco per le attività di internazionalizzazione, sulla base di diverse prospettive e, in particolare, sull’utilizzo e il trattamento di dati socio-economici, demografici e industriali che si presume siano correlati, direttamente o inversamente, all’attrattività dei paesi per i settori di attività di interesse. L’approccio è esemplificato con un semplice modello di supporto alle decisioni, articolato su più criteri, che può essere adattato ad altri temi manageriali critici, quali la classificazione di clienti o linee di prodotto.
Commenta (0 presenti)
Outline
1. Introduction and objectives.
2. The need for selectivity.
3. Pre-screening
3.1. Setting thresholds on selected parameters
3.2. Capitalizing previous experience and contacts
3.3. Competitive benchmarking
3.4. Focus on groups or blocks of countries
4. Data collection
5. Analysis, and screening of short-listed candidates
5.1. Choosing the most relevant variables for the business of interest
5.2. Weighting the variables
5.3. Standardizing the data
6. An illustrative model
7. Summary and conclusions
1. Introduction and objectives
Selecting the target countries, together with the selection of the entry mode, is one of the first and most important decisions of any company’s internationalization strategy.
Not only the newly exporting companies, but also those which already have a presence abroad, could face the following problems:
- how to expand the international presence: which new countries to enter
- how to assess the current presence, with the objective of re-launching the internationalization activities and better reallocating the company resources to the most promising targets: which countries to focus on, and, possibly, which ones to withdraw from in order to make more resources available for the selected targets.
These issues have been addressed by many authors. However, as far as we know, none of them suggests an integrated, flexible, and simple operational model that could concretely help the interested companies (especially, SMEs) in making a systematic assessment of the available alternatives. Most authors of international marketing books are either too qualitative (Douglas & Craig, 1995) or simplistic (Bennett, 1995; Hollensen, 1998), while writers in academic journals are often too complex and/or context-specific (Sakarya et al., 2007).
This paper provides a systematic approach for preliminarily addressing these issues in an explicit, coherent, and practical way: the proposed judgmental model can easily be applied to any industry sector, provided that the decision maker is knowledgeable about the most relevant characteristics of his/her business, and aware of the objectives and limits of the analysis.
2. The need for selectivity
Together with other related decisions (entry mode, partner selection, etc.) the choice of the target countries is a typical issue in which the firm faces the following situations and constraints:
- Significant number of relevant alternatives
- Need for critical mass in relation to each alternative
- Limited resources for pursuing multiple alternatives at the same time
- Significant opportunity costs if resources are allocated in a sub-optimal way.
It is therefore essential, especially for SMEs, to be very selective, and focus the limited resources on the most promising targets.
The following figure presents a simplified logical sequence of steps that should be conducted in order to identify a set of meaningful and feasible strategic alternatives, in terms of business-country-entry-partner, and it is clear that all these choices are strictly interrelated.
Figure 1 – Marketing research steps for country selection
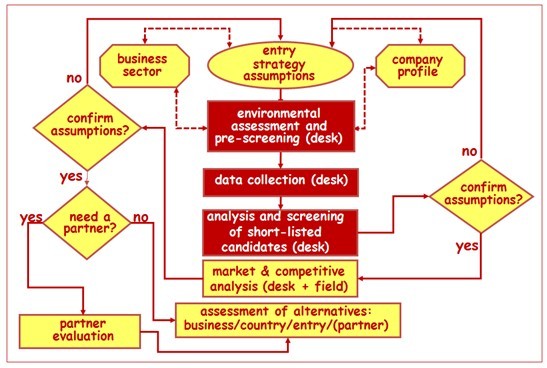
Focusing our attention on the preliminary desk-based selection of the target countries (the final decision could only be made after an in-depth investigation, in the field, of the market and competitive context in the short-listed candidates), the following will be the major issues addressed here (see boxes identified with a dark background in the figure):
- which methods are more appropriate for identifying a short-list of country candidates?
- which criteria should preferably be used for implementing these methods and making a decision?
- which technical and logical guidelines should be adopted for processing the information and data to be analyzed?
The final output of this process will therefore be the identification/selection of one to three foreign countries on which to conduct a more in-depth investigation.
3. Pre-screening
Let us assume, for the moment, that you already selected the business of interest and that “exporting” is your preferred entry strategy (both decisions are obviously subject to subsequent in-depth evaluation, based also on the results of our preliminary analyses).
At least in principle, there are more than 200 potential target countries: it is obvious that we need a method for identifying, in a relatively simple and cheap way (i.e. based on desk research, probably via web), those on which we will conduct a more accurate analysis.
At this stage, our common sense suggestion is that you should be very selective, getting rid of most countries which, based on our judgment, previous knowledge and experience, do not seem to be particularly attractive. The important thing is to be explicit about the selected criteria and aware of their potential implications (for example, missed opportunities for having rejected groups of potentially interesting candidates).
3.1. Setting thresholds on selected parameters
This is certainly the more systematic, if not “scientific”, approach for drastically reducing the number of potential target countries. For example, once you have collected the necessary data (see next section), you could decide that you do not want to consider countries which have a population and/or a per-capita GDP below certain levels.
If the candidate countries must satisfy, at the same time, more than one condition, and if the level of the thresholds is relatively high (compared to the average value for the chosen parameters), you will see that the number of “survivors” could easily drop to about 10% of the initial population of countries.
In any case, you can complement this approach with one or more of the qualitative criteria described below.
3.2. Capitalizing previous experience and contacts
Your company could have had, in the past, some contacts with clients of other countries. If these experiences were promising, even though just occasional, they could represent a good starting point.
It is also possible that you are already present in some foreign countries. In this case, it could be meaningful to target countries which, for socio-economic, cultural, and political reasons, are similar to those in which you operate.
Another possibility is that some employees of your company come from foreign countries, or have had working experiences in these countries: they could be an interesting means for identifying appropriate information sources or getting in touch with prospective clients or partners.
Obviously, all these considerations are not “scientific” at all, but, together with the other criteria described below, they could help you at drastically reducing the number of alternatives to a manageable set of candidate countries.
3.3. Competitive benchmarking
It is very likely that your company is not the first one, in your industry sector, which decides to go abroad.
A criterion for identifying the target countries could be the presence of direct and successful competitors, on the assumption that their choices were based on in-depth analyses and research, and that their success is an indicator of market opportunities for new entrants.
On the other side, it is obvious that the presence of strong competitors could significantly limit these opportunities, and nobody could guarantee that your company would enjoy the same success. Furthermore, it is certain that you could not exploit the so-called first mover advantage.
However, the similarities between your business and the competitors’ business would certainly prevent you from “jumping in the dark” with your decision of entering these markets.
In any event, if this is a criterion you want to use, in the “market & competitive analysis” phase it will be very important to collect appropriate information about the competitors, analyze their internationalization strategies, and identify the reasons of their successes or possible failures.
3.4. Focus on groups or blocks of countries
Many countries form among them free trade zones, customs coalitions and common markets, regulated by regional or sub-regional agreements. Focusing the attention on countries which are part of these agreements could be convenient: in general, entering one of them could facilitate the access to the other partners.
For example, we can mention the European Union, the EFTA (European Free Trade Association), the NAFTA (North American Free Trade Agreement), the ALADI (Asociaciòn Latinoamericana de Integraciòn), the Mercosur (Mercado Comùn del Sur), etc.
Another possibility is focusing on “informal” groupings of countries: you certainly heard of “developed countries”, “Asian tigers”, NIC (Newly Industrialized Countries), etc. All these expressions refer to informal clusters of countries, identified based on statistical analyses conducted by international bodies, associations, research institutions, etc.
If you think that the parameters adopted for creating these groups are in some way correlated to the consumption of your products, it could make sense to target, first of all, the countries which belong to the groups.
4. Data collection
Today it is much easier than in the past to collect macroeconomic and socio-demographic data which are published, often free of charge, by various institutions, both domestic and international. Just as an example, www.cia.gov/library/publications/the-world-factbook.
Apart from some exceptional case, it is obvious that the selected variables (among those made available by these sources) are quite generic, and cannot be “business specific”, i.e. directly related to the various industry sectors of potential interest, like, for example, number and strength of direct competitors.
However, it is easy to see that, depending on the sectors, some variables could reasonably be considered, at least to some extent, correlated to the market potential in the same sectors: for example, it is certain that “population” and “per-capita GDP”, combined, can be relatively good predictors of market potential for many consumer goods, while “industrial production” is normally strongly correlated to the size of most industrial sectors in many countries.
In any event, the purpose of using a selection of these variables is just that of further screening and ranking the countries which passed the pre-screening phase, in view of a more in-depth investigation (in particular, field research) in the best ranked countries.
5. Analysis, and screening of short-listed candidates
After having significantly reduced, with the pragmatic methods described above, the number of countries to be considered, you will still have a relatively large number of alternatives, probably between 10 and 30 (i.e. between 5 and 15% of the total population of countries): these alternatives will not be rank-ordered, since the various pre-screening methods do not provide ways of “measuring” or assigning a “score” to each country.
How to manipulate the available databases for the surviving countries, and how to rank these countries?
5.1 Choosing the most significant variables for the business of interest
Here, again, the common sense suggestion is obviously that of being selective as much as possible, that is:
- define, as precisely as possible, the industry sector of interest, in terms of both end-users (nota) and products or services
- identify the variables which, in your judgement and based on your industry experience, seem to be more correlated (either positively or negatively) with the market attractiveness for your industry sector: our feeling is that a maximum of 10 variables (and even less) could be largely sufficient (nota) : these variables could be either objective (such as the population of a given country) or subjective (such as the physical distance between a given country and the decision maker’s country), but they need to be measurable (expressed either with absolute numbers or with an index)
- specify the “direction” of the correlation: some variables are positively correlated to the market attractiveness (such as “population” in the case of consumer goods: the higher its value, the higher the attractiveness), others are negatively correlated (such as “cultural distance”: the higher its value, the lower the attractiveness)
- among these variables, prefer those for which all the data describing the candidate countries are available
- finally, avoid taking into consideration variables that seem to be strongly correlated among themselves (i.e. whose behaviour looks similar): for example, the per-capita GDP is evidently correlated with the Human Development Index, since this index is made of a basket of indicators which includes the per-capita GDP (nota) .
In this way, you will come out with a very manageable database (for example, 8 variables for 20 countries), ready for further manipulation and analysis.
5.2 Weighting the variables
Based on your industry knowledge, you will immediately realise that not all the selected variables are equally important as “predictors” of market attractiveness. It will therefore be important to attempt an estimate of their relative weight, for example in percentage points (making the overall importance of all the variables equal to 100) (nota)
.
As a matter of fact, the weighting of the variables confirms the importance of avoiding variables which are strongly correlated, since otherwise you would incur the risk of double counting, that is assigning a disproportionate importance to the same factor (expressed by the correlated variables).
5.3 Standardizing the data
It is practically certain that the selected variables will be expressed with different units of measurement (for example, millions of people, thousand dollars per-capita/year, etc.) and different scales.
In order to weight the data according to the relative importance of the corresponding variables, and arrive at an overall assessment of each country’s profile (based on a joint evaluation of its performance on the different variables), it is therefore indispensable to translate all the different units of measurement into an homogeneous scale, i.e. using the same unit of measurement for all the variables, so that it will be possible to multiply the values of each variable (for the different countries) by the weight of that variable, and sum together the results obtained for each variable and each country, in order to obtain an overall “index of attractiveness” of the individual countries (nota)
.
This methodology will be clarified by the example that follows.
6. An illustrative model
In order to exemplify the methodological approach described above, we will use a very simple model, which will produce a classification of 5 countries in terms of overall expected attractiveness, based on 4 variables
The objective will be the identification of the most interesting country (or countries), on which to focus the future in-depth market investigation with the available resources: especially for SMEs, it is indeed difficult, if not impossible, to conduct this investigation in several countries at the same time.
Let us assume the following:
- the hypothetical business of interest will be “fashionable synthetic furs for young medium-high income women”
- the 5 countries which survived the pre-screening phase, the 4 selected variables (the last one, “average temperature”, is negatively correlated to the market attractiveness), the corresponding actual values for each variable and each country, and the statistics that we will use for standardizing these values are those described in Table I (nota) below
- the estimated relative importance of the variables is described in percentage points on top of the table.
In order to calculate the overall attractiveness of these countries, we need first to translate the actual values of the different variables into an homogeneous scale, released from the original units of measurement.
What we want is to discriminate as much as possible among countries, in order to avoid the risk of considering equally attractive countries that actually have a different profile.
Table I – Original data (hypothetical rounded values)
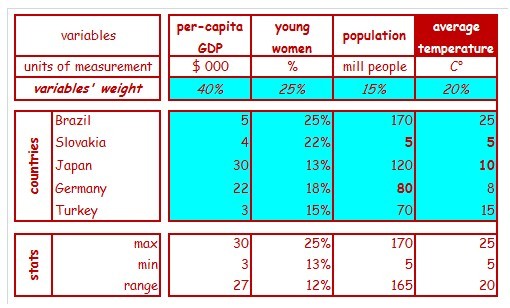
One of the most useful standardization methods, in this case, calculates the new values, for each variable, comparing the original values to the range of variation of the variable (nota)
: it will therefore be sufficient to subtract from the original values of each country, on a given variable (for example, 80 million people in Germany), the minimum value found in the database for this variable (5 million people in Slovakia), and divide the result (80 – 5 = 75) by the range between the maximum and minimum value of the same variable (170 in Brazil, less 5 in Slovakia = 165), obtaining the standardized value of 0,45 (that, for ease of presentation, can be multiplied by 100, and give 45) (nota)
.
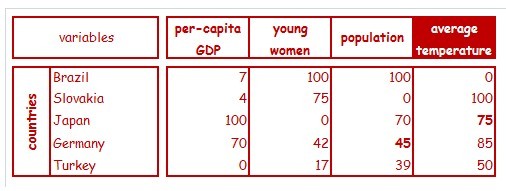
For the variables negatively correlated to the market attractiveness (“average temperature”, in this case: the higher the temperature, the lower the attractiveness), we will take the complement to 1 of the above calculation, and multiply again the result by 100 (nota)
.
All the results of these calculations on our initial database, easily performed by any electronic spreadsheet, are summarized in Table II: you will easily see that, due to the standardization method adopted, we will always have, for each variable, at least a “0” (the worst country or countries) and at least a “100” (the best country or countries).
Table II – Standardized data
Finally, based on the standardized data and the relative importance of the variables, we can calculate, in Table III, a weighted average index, which provides a synthetic evaluation of “attractiveness” (A) for each individual country.
Table III – Attractiveness Index and Country Rankings
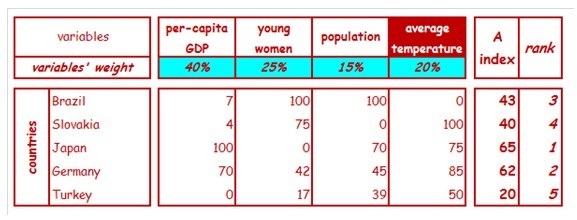
For example, for calculating the overall attractiveness of Germany, we multiply its score of 70 on “per-capita GDP” by 40% (the relative importance of this variable) obtaining 28, its score of 42 on “young women” by 25% (obtaining about 10), its score of 45 on “population” by 15% (obtaining about 7) and, finally, its score of 85 on “average temperature” by 20% (obtaining 17): summing up these four products (28+10+7+17), we obtain the “weighted average score” of 62, that represents the index of attractiveness of this country (nota)
. Keeping the weight of the different variables constant, we perform the same calculations for all the other countries.
As you can see, the electronic spreadsheet automatically calculates also the “ranking” of the five countries, based on their index of attractiveness: in our simplified example, Japan and Germany are by far the most attractive countries, clearly detached from the others.
7. Summary and conclusions
In this article we focused our attention on the decision about which countries to target, and the suggested methodologies for reaching that decision. However, it is important to emphasize that these methodologies are mainly based on the collection of secondary (and mostly generic) data and desk research: the final decision, together with the other important choice related to the entry mode, could only be made after further and more in-depth investigation, in the selected country, about many other and more business specific aspects.
If we were to make a decision, based only on the data presented in the illustrative model, about where to go to collect more business specific information, we would probably go to Japan. However, as with many other similar decision support models, their purpose in mainly that of helping us at clarifying our thoughts, making explicit the reasoning behind our decisions, and identifying areas or aspects worth of further attention.
For instance, in the illustrative model it is apparent that the first two countries (Japan and Germany) have a very comparable level of attractiveness, but we know very well that they are quite different from many other perspectives: the addition of other variables (such as, for example, the “physical” and/or “cultural distance” from the exporting country, which entails significant marketing and operational costs) could significantly alter our conclusions.
Finally, it is worth noting that the conceptual structure of the proposed multicriteria decision making model can be adopted for addressing other critical managerial issues, such as the classification of clients or product lines, i.e. whenever we need to assess the performance of multiple entities and, therefore, select among alternatives, based on multiple criteria. For example, the model could be very useful for classifying and managing different clusters of clients, based on variables such as overall purchase potential, actual purchases from the firm and related profitability, and average payment terms.
DOI 10.4439/ig6
Bennett R.
(1995),
International marketing: strategy, planning, market entry & implementation
, London: Kogan Page, pp. 50-56.
Douglas S. & Craig S. (1995), Global marketing strategy, New York: McGraw-Hill, pp. 128-136.
Hollensen S. (1998), Global marketing: a market responsive approach, Hemel Hempstead: Prentice Hall Europe, pp. 117-130.
Sakarya, S., Eckman, M., & Hyllegard, K. H. (2007). Market selection for international expansion. Assessing opportunities in emerging markets, International Marketing Review, 24(2), 208-238.
Commenta (0 presenti)
Visualizza articoli per
Funzione
Settore
Rivista
Ricerca
Supporto
© Copyright 2011 Federmanager Ancona Pesaro Urbino, Piazza Roma 7, 60121 Ancona - mail: an.pu@federmanager.it CF: 93007370427